
Analysis of accounting schemes
What are we looking at on this dashboard? It’s basically, we have a dashboard that’s going to show us information about our general ledger. Now, when we do this dashboard for you for real, the FCPA one, it’s going to have more flags and more information and more stuff on here to give you more clues about if you have a particular risk. So for it to be like, but we’ve got the standard ones here, like for example, is it manual? So you want to see, okay, if I’ve got a manual journal entry, I can click on this one.
I might want to just only look at manual journal entries because maybe those are the only ones that really interest me. Now, I might be thinking if it’s automatic or something, then it’s not going to be something that’s a big risk. Probably not. And then what you want to be able to do is have a quick look at the description of the journal entry. And this one is based on the manual description. So all of these ones we’ve gone through, and we’ve like looked at it manual way. And we’ve said, you know, what do we think this is? But there are quite a lot of these. You know, you see it’s quite a lot of work. So what we want to do is we want to be able to see if we’ve got potential risk.
So what we actually do, and we can do this in advance of actually putting stuff into the dashboard is to flag things as having a potential risk. So for example, I can say, all right, what about if I have a bank payment and cost? Okay, so bank payment negative impact on the profit and loss account. So if that’s happening, then it’s probably something that is quite strange, unless it’s going to be a foreign exchange adjustment, right? So in that case, I’ve clicked on this one as a potential risk.
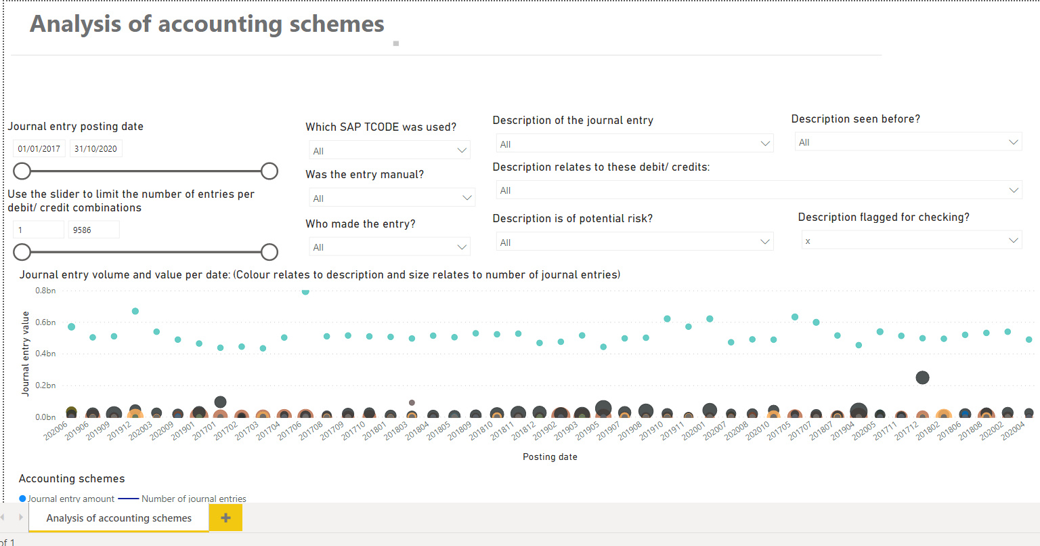
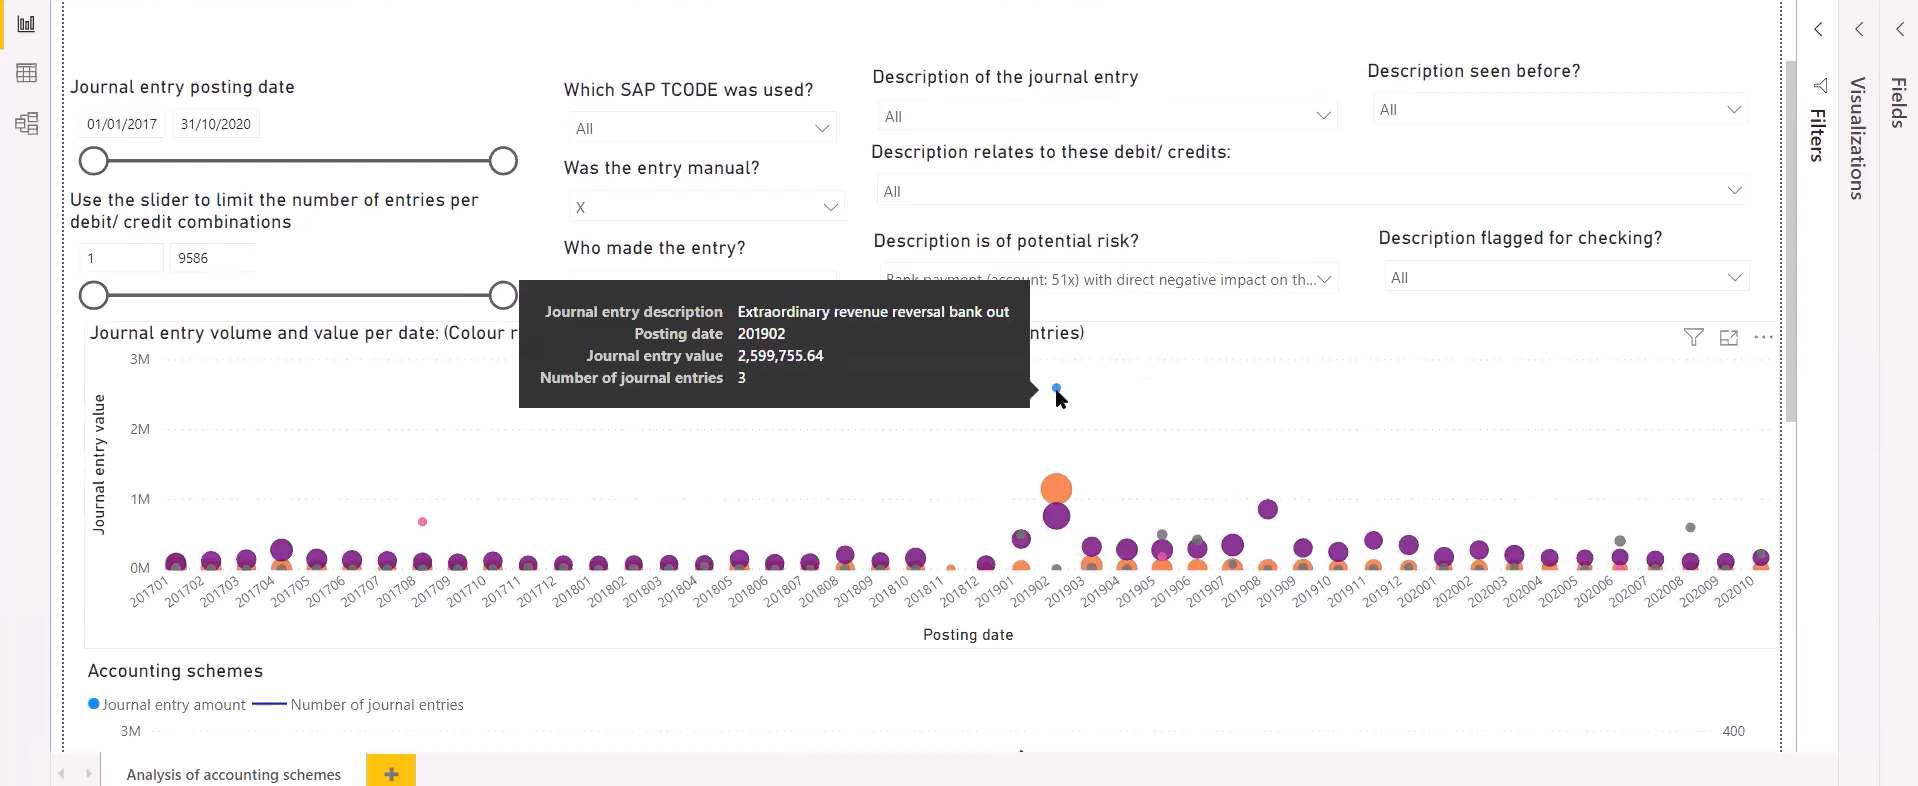
I can see also, is it something that we flagged before as something to be checked? Probably is because it’s still staying there. I could take that on and off. And then I can see on this graph. So this graph, let me explain this graph to you. This is a scatter diagram that’s done by date. And basically what it means is each dot is a journal entry accounting scheme. So each dot is saying, if I hover over it, you can see, we’ve got the description of the journal entry. So this one, for example, we’ve got extraordinary revenue reversal with a bank out. So basically what it is, it’s like we have, instead of debiting cost and doing credit bank, we’ve debited profit, but which is not normal, right? Because normally profit is on a credit side, but here we’re debiting it.
So that’s why I’m saying it’s reversal. And also that profit account is extraordinary revenue. So it’s nothing very specific.
And it’s also for quite a high amount. And here you can see, we’ve only got three journal entries for this one, which this is quite a lot. I mean, quite rare. So you can actually click on that and then you can see when is it happening. So it’s happening just after, or just the beginning of the year around closing time. Okay, so here we can see these journal entries and you can see this one is highlighted here. This is our extraordinary revenue account. This is in French accounting schemes. So this is how we can easily get a view of all of our journal entries by having these dots over the entire period and being able just to click on them and to look at them straight away.
What we do is we have underneath all of that, the detailed tables. So you can actually go into SAP, quickly look up that journal entry and see if there’s any supporting documentation. So the point is, it’s like this FCPA dashboard, or not this one particular, because it’s not the real like FCPA dashboard, but the FCPA dashboard we’re gonna give you is gonna be very similar to this, but it’s gonna have a lot more flags and all that stuff.
And what we’re gonna be able to do is to say, I want to pick out those particular journal entries that look like risk because they have a strange accounting scheme or there’s lots of different strange flags, you know, like it’s one time vendor, but it’s a really high amount and it’s happening all the time. Or it might be that we have a list of the people working in the entity and we know who the CEO is. And we wanna see like, oh, manual entries entered by the CEO.
What kind of accounting schemes, why is the CEO entering journal entry, all that kind of thing. So all these questions that we can ask each other. And on our next web class next week, what we’re gonna do is we’re gonna go through the FCPA and we’re gonna map all the questions that we could have as an auditor to the dashboard and answering those questions with the dashboard.
And that’s gonna help you to like really like connect the dots between the SAP sort of data and how we present it and what we’re actually trying to ask ourselves in terms of questions when we’re actually doing the audit.