
FCPA data visualization - part 4/4
So another thing, right, if we finish with the reporting, and now if we have places that we are paying and they are in, for example, tax haven. So here we don’t have any, but if I did take all of this data from 1994, we do get something in Mexico. We just want to have a map to see for all of our payments that are going out of our payment programme, because in SAP you’ve got your payment programme, you can see the actual country code where you’re paying it.
That gives you some kind of strategic advantage. And this stuff’s happening all the time. So we want to see where the money is going.
And this map here, country for the bank out, is going to tell us. And what we’ve done here, we’ve done by inverse number of entries. So what does that mean? So it means that basically, the dot is going to be bigger, if it is rare, right? So if, for example, if I did put in the data here from 1994, you would see there’d be a massive dot for Mexico, because basically, what happened in 1994, in this data is that there was a one-off payment to Mexico, but it’s actually really rare.
So you don’t do it all the time. So because if you are paying to a particular country all the time, it’s like normal business, it’s normal operations, and it’s probably not going to be very risky. But if you’ve got one or two, or maybe 10 payments to the Cayman Islands, and they’re also quite high value, you want to have that huge dot on your map so that you can actually see it.
So what we do is we do the inverse number of journal entries so that we can actually see that. Okay. And here we’ve got all of our customers and suppliers right next door, because we want to be able to see where they are. So if I look at this one, this customer is called Ship Project. It might not be a real customer. Let’s just assume that this one, Ship Project, doesn’t really sound like a real name to me.
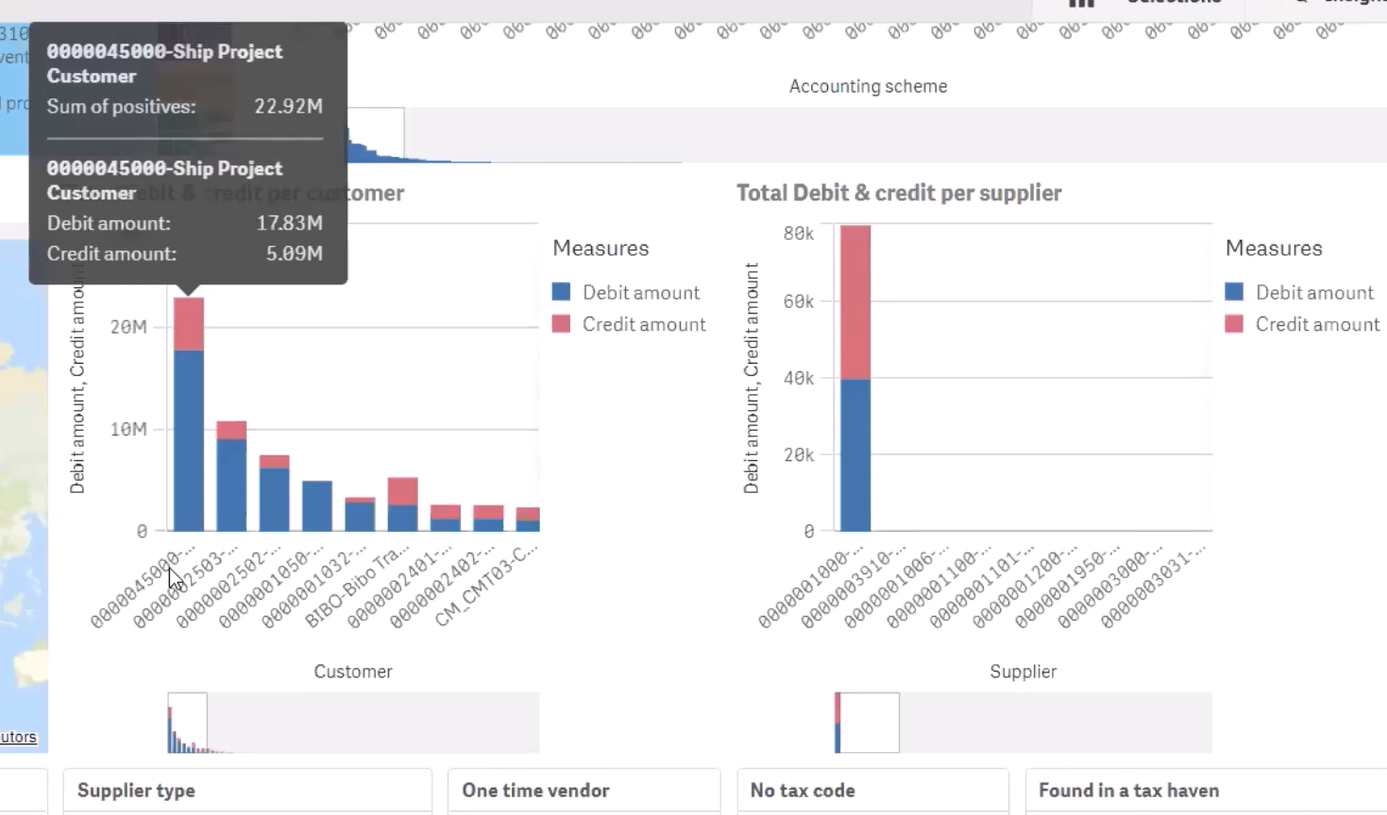
If I click on it, then I can see where we actually pay this one. Are we paying it in which country? And it will tell us if we can see where we’re paying it. Now here you can see that we don’t actually see where it’s paying. And that’s because we may be paying it through a system that’s not the payment programme. So this map is the SAP payment programme. But you don’t have to do your payments through the SAP payment programme.
You can also do them as manual journal entries. So if they’re not in your SAP payment programme, it means that you have even less control for your payment. So that’s also quite a good indicator to have. And we can see, we’ve got other graphs down here, similar ones, where we can see the number of transactions versus the value. Because if you have a supplier that’s having a huge value, but hardly ever any transactions, it means that they’re kind of like one-off. They’re not part of your regular business. If they’re not part of your regular business, you obviously want to check out what’s going on.
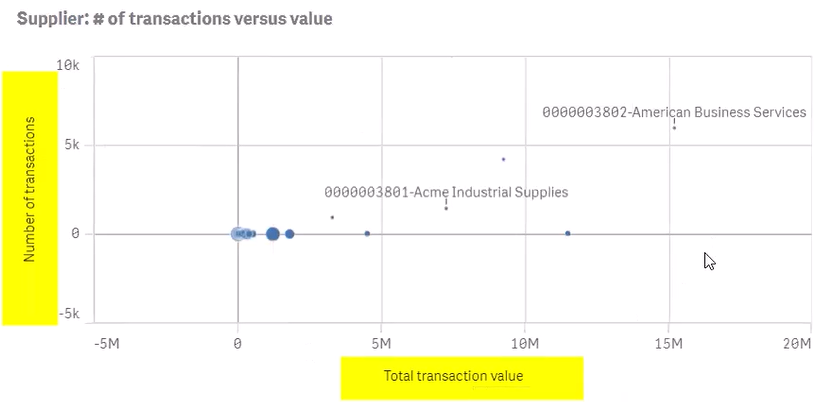
So we can click on this little dot here. For example, we can see this one is about life sciences. We’ve got 11 million going to them and 36 transactions. The scale is quite big here. So you know, it looks like there’s none, but there are actually 36.
But if you have a supplier that’s got like, I don’t know, one transaction and it’s a huge amount, then it’s something you want to look at. So you can click on these dots and it’s just going to give you an idea of what’s going on with these particular suppliers. This one’s got 26, you know, so you can click on those to see straight off.
So scatter diagrams are really useful for seeing those type of things immediately. Just as a supplier, you might want to see what kind of customer it is, or what kind of supplier it is. So if we, here you’ve got general customers, salty party, like all different types of things.
And you might see that you have something that’s just generic customer or one time vendor. You might see something like that. Here you’ve got “do not use”, for example. So you’ve got something like “do not use”. I think it says do not use, but maybe somebody actually does use it. And it’s got that flag do not use. It might be because they don’t want anyone to put that on the ageing balance. And actually you do want to check it.
So in fact, I just clicked on “do not use” and the customer type. And again, the customer type is coming straight out of SAP. It’s in a SAP table.
Another thing you want to check is if you’ve got the official flag for one time vendor or one time customer. So in SAP, there is actually a field that says this is a one time customer. This is one time vendor.
So we don’t have any flag like that here. We might have some here. Let’s just check.
We do have some one time vendor. So I can click on this.
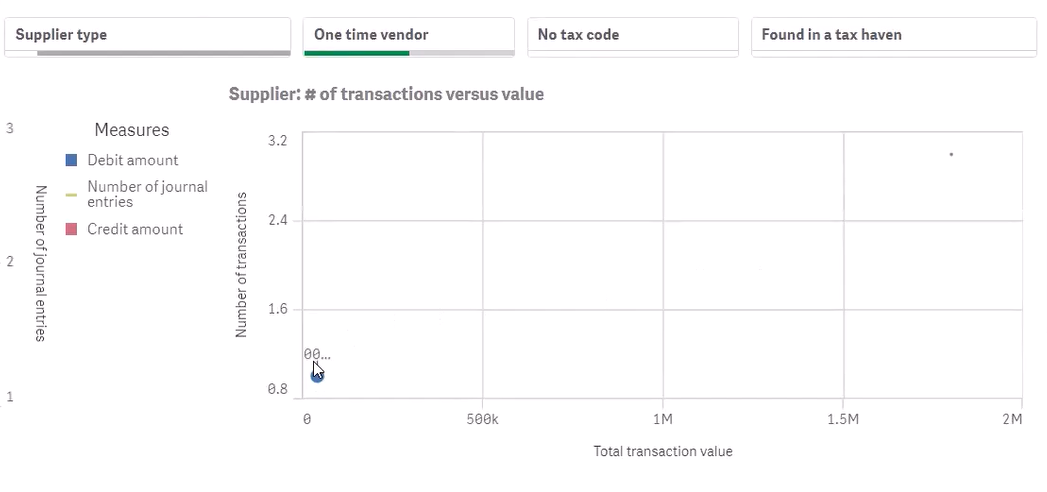
This is like the official someone’s actually said, this is one time vendor account, which doesn’t often happen. Sometimes you get supplier types as one time vendor and it’s not flagged as one time vendor. So if we have one time vendors, what do we expect? We expect that they are one time. So we don’t have many transactions and the value is going to be low. We don’t expect to see much for them at all. Normally you’d see quite a lot, but this data is from the SAP sandbox. So you’re not seeing too much.
You also want to check like, maybe they don’t even have a tax code, maybe they are found in a tax haven. So other things that you can check about them just by using those filters.
You might want to check some SOD like separation of duties information. And we’re going to talk about this issue of like the same user doing different things on the same document flow, because that’s really key.
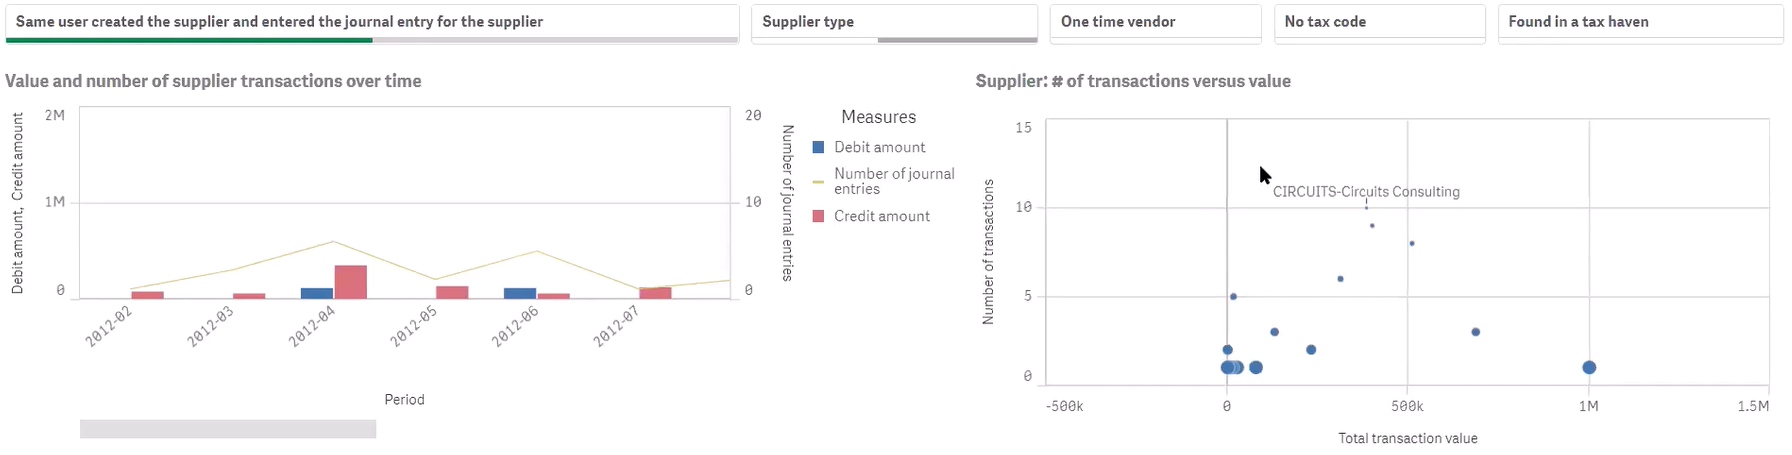
So here I’m just like saying, okay, I created the supply and then I enter general entries for that supply. That’s like really risky, right? We should never have people doing that. So if somebody is actually creating a spine and they’re entering entries for the supplier, then they could be like, you know, create this fictitious agent or whatever it is. And then I’m going to enter general entries, invoices and payments for them. They’re not real, but I’m going to just enter all the stuff that I need to enter into SAP to be able to get that money out of the company and then use it as a bribe. And that’s how I’m going to fuel my bribes.
If you are interested in our free FCPA one pager, just send me an email ([email protected]) and then we will send you a link and you’ll be able to get that Qlik application. If you don’t have Qlik, don’t worry because there is a two week free trial. So you can actually put it in Qlik for business or whatever, and you will be able to see still all the logic and the dashboards and all that stuff.
And it comes with the dummy data that we’ve put in there already. So you can like get a feel for it.