
Top 10 Data Analytics for Fraud Detection – Part 1
Number one of our top 10 is going to be illegitimate journal entries
I’m going to show you a demo of a really cool dashboard that we have that we can actually use to look for journal entries in a snap that are a bit strange, okay? And it’s way better than anything I ever did at Deloitte. For me, the number one most important data analytic is illegitimate journal entries and the reason for that is because it has the highest financial impact in case of fraud and that hardly anyone is doing it. I don’t mean hardly anyone is doing illegitimate journal entries, I mean that hardly anybody is properly looking at their journal entries even though we have Sapin 2 in France which is a law that says that you basically you need to go through and be aware of all of your journal entry postings.
Despite that and despite things like the UK Bribery Act and all that stuff, people are still not looking at illegitimate journal entries. And despite the fact that in 2010, we had the SAS 99 law that we were looking at at Deloitte that said we had to look at journal entries as part of external audit and we were still not really doing it very well. So hardly anyone is doing it and I think that it’s so important just like the the customer that we had when they went over to Brazil and they found a huge fraud case that it almost caused them to shut down the entire group because it was such a misstatement over a few years. So it is really important and sometimes we find little things like people they might do credit debit refresh of their accounts receivable just to make sure their accounts receivable looks correct or they might even do it for their stock. They might do a sort of a fictitious like take all the stock out and put all the stock in again so the stock looks like it just got there. And it doesn’t go into slow rotation things like that so there are little cases and then there are big cases where we really do say like you know we’ve got 20 million of revenue this year and it’s not actually true at all. So it’s also really key one for me illegitimate journal entries because it covers so many different areas and so many different fraud schemes. And it’s also used to cover up on fraud as well. So another thing about it is that you don’t actually need that much data so we need a lot of data in terms of by the volume but you don’t actually need that many tables which is nice because you don’t have to understand too much about SAP before you start doing it and that is really good so you only need the general ledger table and when you’re doing it you do though need to do a little bit of processing.
So I’ve put down here, you need to do a little bit of processing need to create some lists of debit and credit accounts and you can create some lists of like debit and credit account indicators and things like that and this would basically help you to see for one journal entry what were all the debit accounts that got debited and what all the accounts that got credited and that way you get to see what was the person actually doing. I’m going to show you what I mean by that in just a second. So when we are doing analysis of illegitimate journal entries we are going to take our general ledger table and we’re going to add a load of fields that are going to really help us to be able to analyse this general ledger table really easily.
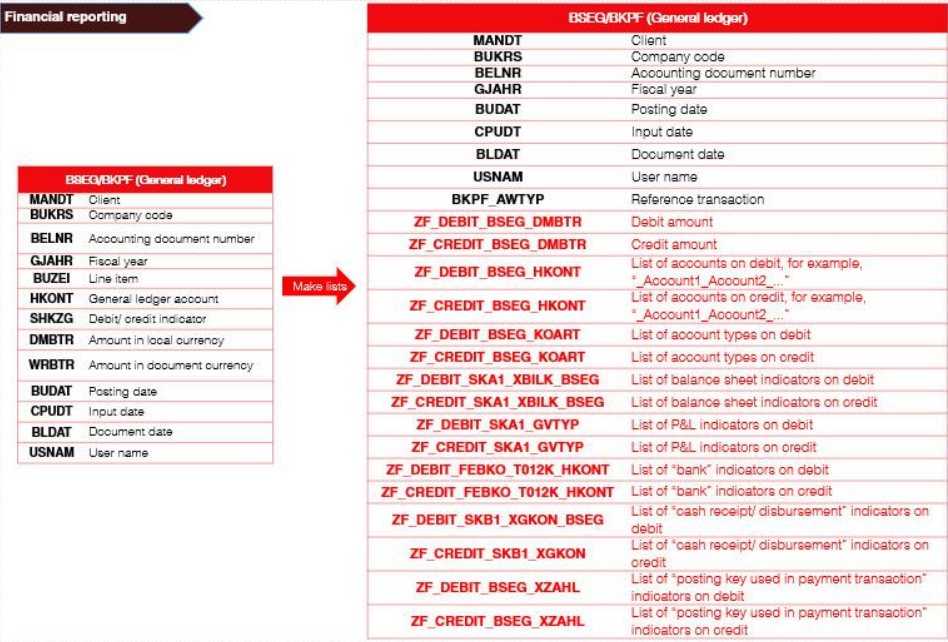
So when we get on with our accounts you know if we’re in France and we know that a six account is for cost and a seven account is for profit and a five account is for bank and things like that it’s much easier right you’ve got 401 for suppliers you’ve got your 411 for customers but not everybody has that kind of rule of their accounting. So we also have other things that can help us so we have these things that help you to see in a CEP is your account to do with balance sheet, is it to do with profit and loss, is it to do with bank or disbursements or something like that and is it something that’s used in a payment transaction and we can also add into here the list of the types of suppliers.
So something strange that SAP does is that in your supplier list you also have a whole lot of employees and that’s because employees get travel and expense right so and you’ve also got suppliers that are intercompany and then just normal suppliers so you don’t want to call something a supplier invoice if it’s actually an employee travel and expense.
so you can also do the list of supplier account types and also lists of customer account types and this is really going to help us.
And if you have something like one of our customers, they have general ledger hierarchies and it basically describes the account in a bit more of a synthetic way. Those are really helpful as well .So we make all these lists and we basically make for each journal entry. We make all these lists and then we make a summary table. Once we’ve made a summary table we get something like this we say here here. I’ve got an account type K and account type S. It is bank because I flagged it as a bank and this kind of information is what we use to actually categorise our journal entries, the list of accounting schemes that we typically would use to check for things. So for example, I’m going to show you this in a minute we want to look for things that are hitting profit and loss and they’re hitting something opposite which you wouldn’t normally expect them to right.
So for example, this one also what we would normally put in here is like okay you’ve got profit and loss on debit and maybe you’ve got here we’ve got VAT on credit but you could also say and what if you had bank on credit so if you went from loss to bank and that in one journal entry. And you don’t bother going to the supplier first so you don’t bother saying I’m going to credit my supplier and debit loss. And then when I pay the supplier I’m going to debit the supplier and credit the bank because that way I know who I’m actually paying.
But if you don’t want anyone to know who you’re paying, you could just like put something on the loss account and take it out the bank. So that would be a bit strange and these are the kind of things that we also look for. So these typical atypical accounting schemes are things that we actually use when we want to make filters okay so now I’m going to show you dashboard so we’ve got like picture of dashboard here but I’m actually going to show you in power bi so this is a Power BI dashboard.

So I’m saying should I be logging in changes made to these tables. There’s a feature in SAP called read access logging which changes made to certain critical field so we shouldn’t actually be changing any of the tables. So we’re only going to get them by read only access hopefully because we don’t want to change anything and if we’re looking for other people that made changes then we’re going to look at the CDHDR CDPOS tables for that we do recommend a list of tables that should be monitored.
And it’s actually if you go into the audit data leaders group, you will see there is a free download in excel and it’s all of the SAP tables and fields that you need for each and every one of 300 recommended must have data analytics. So really recommend that you get that excel spreadsheet because it’s going to help you be able to see in there’s about 2000 lines and you can see which SAP table and field is mapping to which data audit test how do you take into account if there is a debit and a credit to revenue, or if you’ve mixed entry where you have debit to revenue and other accounts and you have credits to a bunch of counts how do you know if debit revenue has the right offsetting credit usually what we will do is just take the first account because otherwise it gets too complicated.
Here you can see we’ve got something underscore. And actually if we look at the list of accounts we’ll show you in here is you can see that you’ve got debit credit.
These are the accounts debited and credited and then sometimes you’ve got more than two lines in a journal entry so here we are debiting three accounts and crediting three accounts so what we do when we are doing this analysis just to be um simple right? Because otherwise it’s going to be too complicated. We first are going to sort the entire table by order of amount on debit. Then we sort the entire table by order of amount on credit so that we can actually see what was the first account for that journal entry in terms of value on debit and what was the first account on credit in terms of value and that helps us to just know okay, if I’m looking at this accounting scheme, let’s just take this one the 421 account is the most important account was the only one on credit but on the debit side the 153600 account is the most important one in terms of value for that particular accounting journal entry.
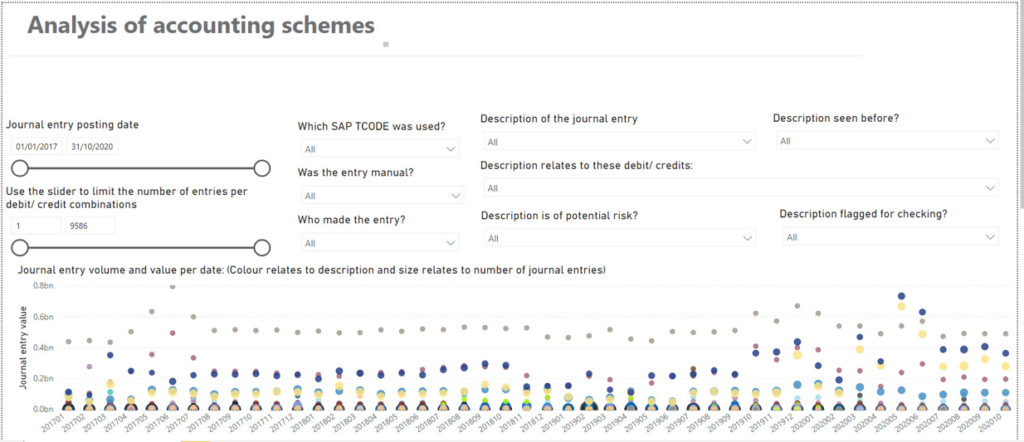
So having a look at this analysis of accounting scheme dashboard. This is our first data analytic and in this data analytic what we want to do is we can see if we’re interested in any particular transaction codes. We can actually have a quick look at them but what we can also do is say all right I want to see everything that’s manual first of all and then if I click on manual then we see that the graph gets updated and then what we want to do is we can say: “All right, have we got anything that looks a bit odd so when I was doing the categorising of our journal entries before so that when we are in here and we’re doing this category and I’m filling in this manually.”
I’m saying this is a supplier payment when I’m doing that I’ve also got another column on the side where I just say this is odd this is odd this is odd so if I see anything I think it’s odd while I’m doing that, I flag it in there. That flag will come through into here. So I can say I want to see anything that somebody has actually flagged for checking and then we also have our potential risk so this potential risk is what’s coming through from the pdf that I showed you this once. This is just an example but you can actually set up your own rules based on your own knowledge of your group but these rules are the things that we are putting into this filter.
So once you have actually already sorted out those rules and you’ve already made your general ledger one line per journal entry of the list of debit counts and list of credit counts, and you’ve got your description of what you think the journal entry might be you can quite easily filter based on these rules, it’s getting quite exciting because now we’ve got manual things. So we know it’s manual, we know it’s something that somebody wanted to check because it looked a bit strange when we’re looking at it, and we know it’s flagged as a potential specific risk.
And in this one we can see the journal entry value all right and the size of the dot is the number of journal entries so we’ve got three journal entries for which we’ve given the description extraordinary revenue reversal bank out and this is the description that we also see up here and it’s also the description that I’m adding in here. This is the manual description that I added to categorise these things. So once we’ve done that description we can click on this one because this one is a high value compared to the others.
So I’m quite interested in this one. I click on that one and then I can go down and I can see a little bit more about the detail so here I can see I’ve got extraordinary revenue 7788 that’s extraordinary revenue on debit with bank out on credit. So for me I don’t know about you but for me that’s a little bit strange and I was want to check what is somebody doing with that journal entry and there’s there’s one of them here which is quite a high value so it might not be material for the entire company but it’s quite high value for an individual to receive that much money if they manage to get that much money out without mentioning who they’re actually paying.
So the point about this one is in this journal entry you can see that we don’t see the third party we just see bank out and extraordinary revenue so that means we don’t know who we are paying for this or or who the bank out is going to and it’s quite an unusual journal entry as well because there’s not that many cases of it actually happening. You can see there’s only one dot here of this thing actually happening once you’ve done all of that mapping and the categorising you can have a little thing here to say have I seen this before so you might do quite a lot of work in the beginning setting up like the categories of your journal entries but once you’ve done that once you can then run this again like maybe every quarter or something like that and you can just check if you have any new journal entry accounting schemes.
So if in the next quarter all of the accounting schemes are the same as in the last quarter then you don’t have any more mapping to do again but if you get something new then it’s worth having a look so hopefully you invest maybe it takes me about one day to do the mapping and then after that it’s fine it’s going to take me an hour or so just to look at the few journal entries that are new for the next quarter.
So a little bit of investment up front but after that it’s fine.